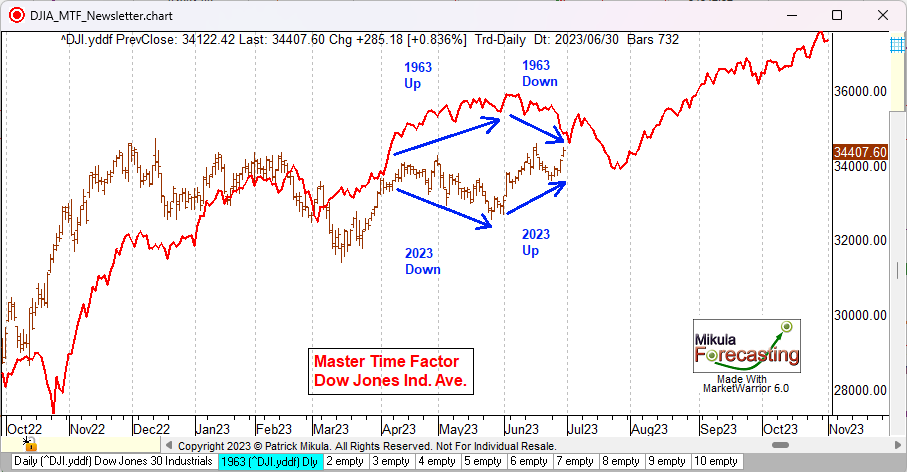
This past week saw the end of June, so I can do an end of month review and compare the DJIA to the historical cycle which it has been following. In the past few weeks, I have written about how the current DJIA is breaking away from the 1963 cycle which it has been following. The current DJIA has been following the 1961-1962-1963 cycle for 2-1/2 years since the start of 2021. This has worked very well to forecast the DJIA, but now the 2023 DJIA and the 1963 DJIA are moving apart. The first chart below shows only the 1962-1963 cycle as a red line. I have added arrows and text showing the 1963 cycle moved up in May while the 2023 cycle moved down. The 1963 cycle moved down in June while the 2023 cycle moved up. Last week the DJIA was up 680.17 points and closed the week at 34,407.60. Having the DJIA follow the same historical cycle for 2-1/2 years is a long time to follow the same historical cycle. The longest period I have ever seen the DJIA follow the same historical cycle is about 3 years, so I would expect the 2023 DJIA to break away from the cycle it is following at any time. Next I will show my current forecast for the DJIA.

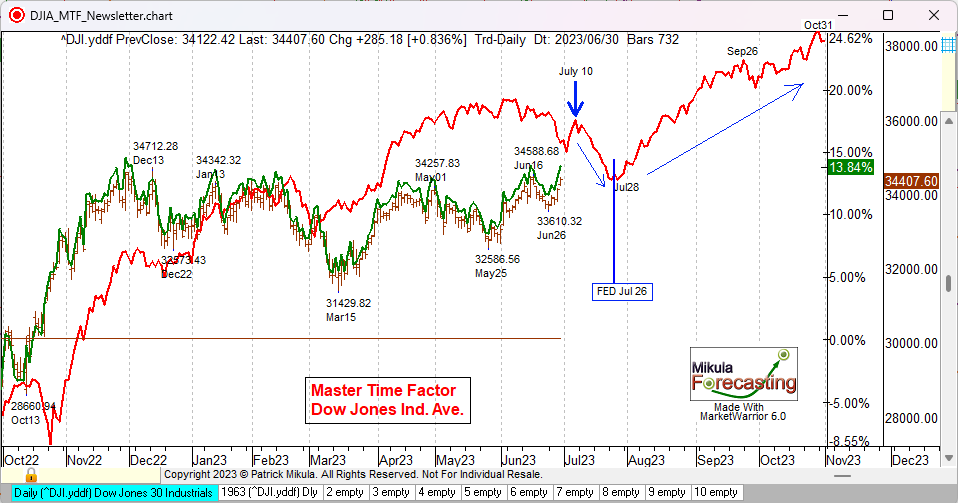
On the chart below I have added the current percent change line as a green line. The 1963 cycle makes a top that aligns to Monday July 10 and then declines until Friday July 28. The next FED meeting is July 26. At this meeting the FED is expected to raise interest rates again. Based on the 1963 cycle which 2023 is technically still following my forecast for the DJIA is for a top around July 10th and then a decline until about July 28th. Near July 28th I will buy long stock positions for the next rally. The bottom around July 28th should hold just above the low price from May 25, 2023 which was 32,586.56. Buying near the next FED meeting should give up a good rally for at least three months through the end of October 2023.

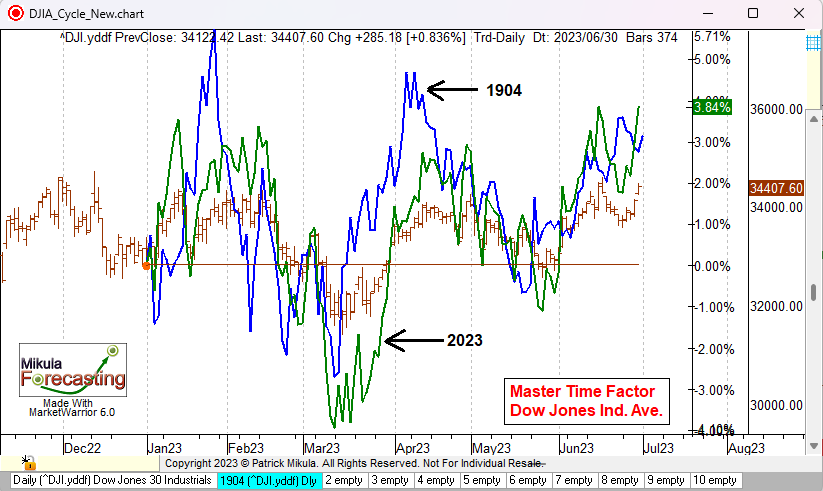
Given that the current DJIA is starting to move away from the 1963 cycle I have been looking for a different historical cycle which 2023 may start following. The chart below shows the best fit historical cycle for the year 2023 through June 30, 2023. The green line is the 2023 percent change line. The blue line is the cycle from 1904 through the end of June. There are 138 years of data for the DJIA and this 1904 cycle is the best fit cycle. On the next chart I will show this cycle through October and explain why it has some major problems.

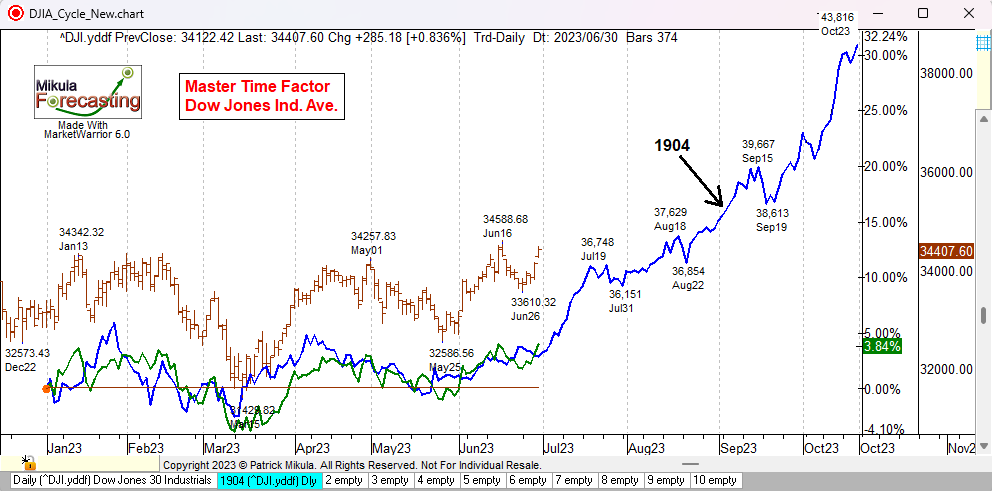
The chart below shows the 1904 cycle extended out through October. This cycle has a massive rally that started after the May 4, 1904 announcement that America was taking over construction of the Panama Canal. This caused a rally that was huge. In 2023 prices it would see the DJIA move up to 43,816 by the end of October and this is not going to happen. I do not see any corollary event in 2023 that would cause a rally like this. Although 1904 is the best ft cycle for the first six months of the year I do not believe the 2023 DJIA will continue to follow this cycle. I have found that large moves like this happen only about once every ten years and most of the time there is only a normal move in the stock market. It would be very risking to make a forecast based on the 1904 cycle unless there was some event to create euphoria like building the Panama Canal, which I do not see today. I will keep looking for a different historical cycle which the 2023 DJIA might start following. Next week I will look based on planetary cycles and election cycles.

end.
