
The DJIA rallied last week but the rally was small and not what I expected. I was looking for a large rally that would lead into the final bear market decline in April. Last week the DJIA was up 497.16 points and closed the week at 41,985.35.
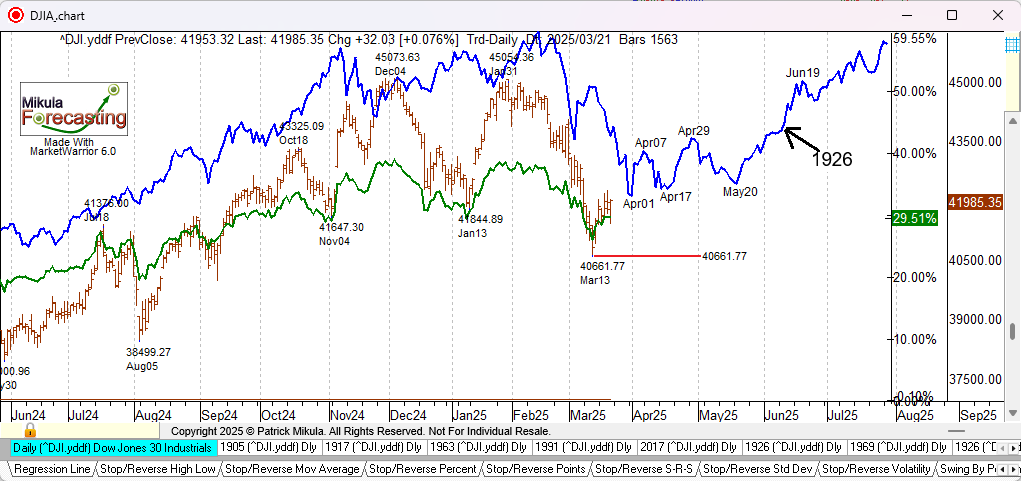
The first chart below shows the historical cycle from 1926 as the blue line. The green line is the current percent change line. This is a daily chart for the DJIA. The 1926 cycle indicated there should have been a rally in mid-March before a decline into April. The expected rally in mid-March did not happen. Based on the 1926 cycle I am still forecasting the annual low price in April 2025 and the target price should be near 40,000. This is just below the March 13, 2025 low price 40,661.77 which I have marked with a red horizontal line below. By the time we reach the end of July 2025 the DJIA should be close to making new all-time highs.
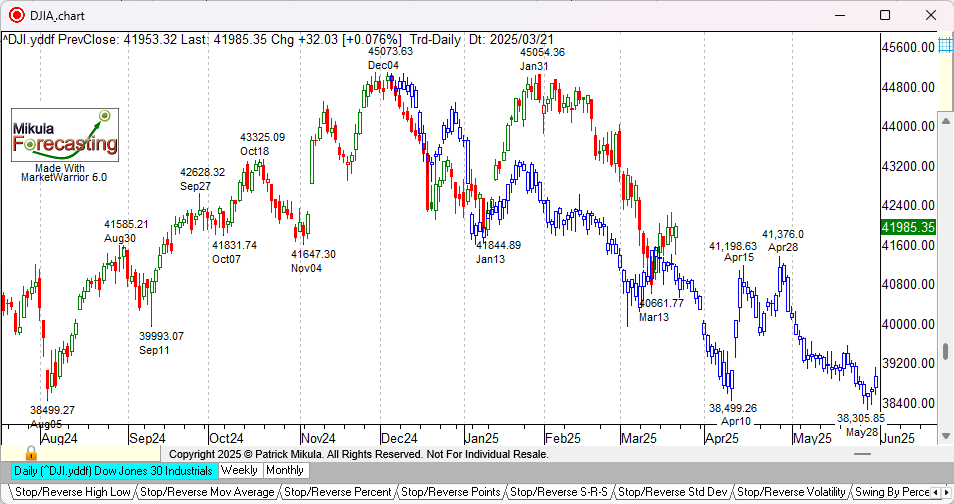
The second chart is an update for my Mirror Bars indicator chart. There is only one more week in the month of March. The Mirror Bars indicator shows a decline next week. The decline should continue into April 2025. Based on the Mirror Bars indicator I am expecting the DJIA to fall into April 10, 2025 and then the DJIA should rally until April 28, 2025. This is a similar pattern to the 1926 cycle seen above.
There should be a decline in May but this is where the Mirror Bars indicator and the 1926 cycle start to diverge. The 1926 cycle makes a higher bottom in May and then starts a rally. The Mirror Bars indicator makes a new low in May and continues down. I believe the DJIA will start a rally in May 2025 and will continue up to new all-time highs by the end of July 2025.
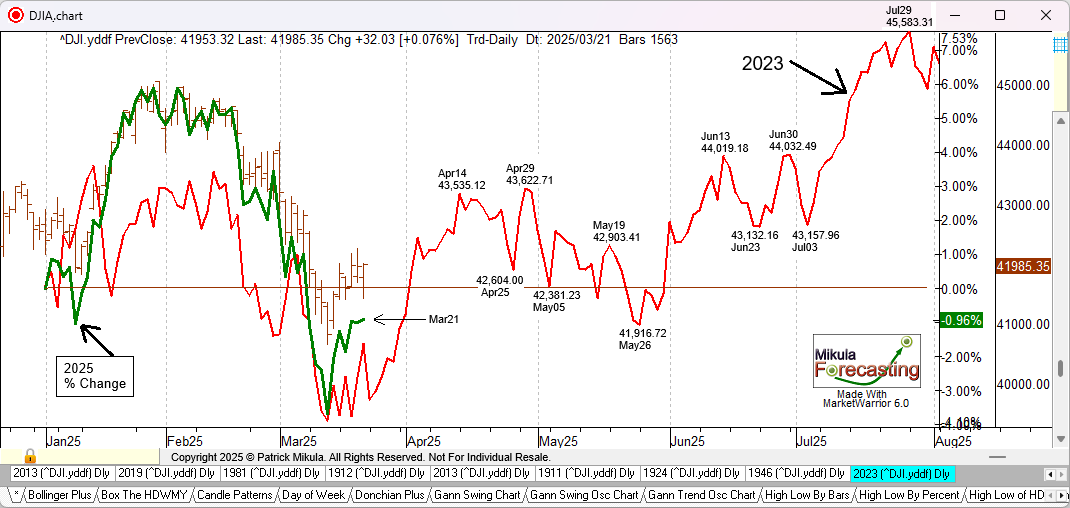
The chart below shows the 2023 historical cycle as a red line. The green line is the 2025 percent change line. The alignment for this historical cycle starts on January 2, 2025. The 2023 cycle is now the best fit historical cycle. This historical cycle is actually very similar to the 1926 cycle above.
The 2023 cycle has a top that aligns to April 29th and the 1926 cycle also has a top that aligns to April 29th.
The 2023 cycle has a bottom that aligns to May 26th and the 1926 cycle has a bottom that aligns to May 20th.
The 2023 cycle then rallied to a top on July 29th when the DJIA will be very close to a new all-time high. By the end of July the 1926 cycle also shows a DJIA price near a new all-time high.
My current forecast is based on the 1926 cycle which shows an annual low in April before the next rally starts.
end