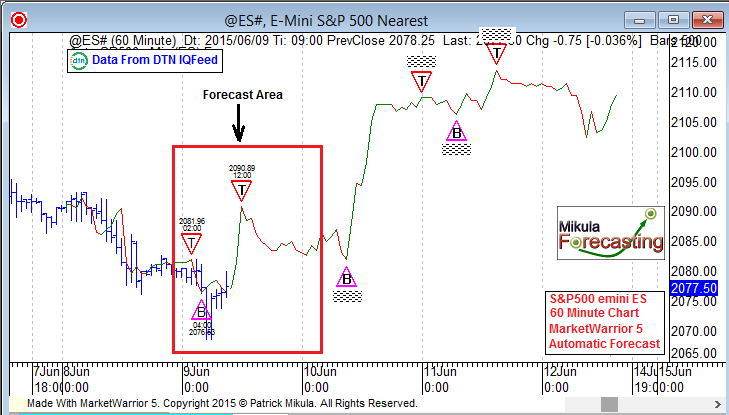
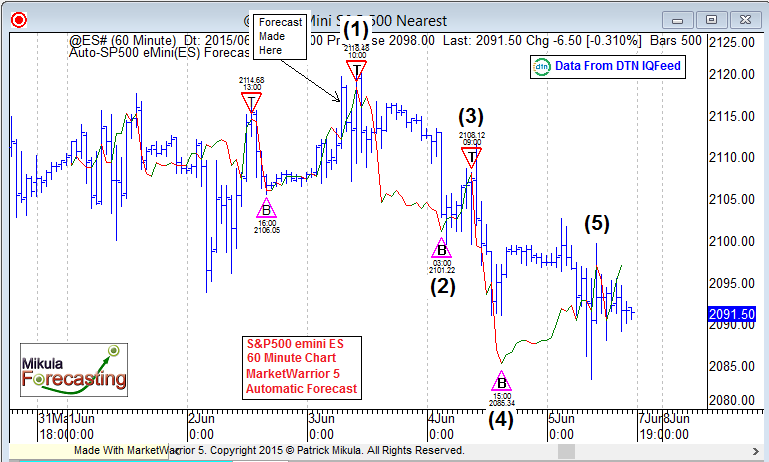
Forecasting the 5 minute chart for the S&P500 E-mini is more complex than forecasting the 60 minute chart. The main reason for the added complexity is that the 5 minute chart forecast requires many more Change In Trend (CIT) to be forecast all at the same time. The charts in this discussion are 5 minute charts using the DTN IQFeed symbol @ES#, which is the continuous nearby symbol for the S&P500 E-mini. They will be showing the forecast and price action for June 9, 2015. The forecast on these charts is made using the MarketWarrior 5 automatic forecast. There are no user settings for the forecasting indicator. There is just one button to click to recalculate the forecast.
On the chart below I recalculated the E-mini 5 minute forecast on June 9, 2015 at 9:25 AM ET before the main trading session opened at 9:30 AM ET. The resulting forecast for June 9 is seen below.

Click To Enlarge
By the time the S&P500 E-mini had progressed about one hour into the main trading session, it was apparent that the market was not following the forecast seen above. The E-mini had made a top at 9:30 AM ET. This was not in the forecast. So at 10:20 AM ET, I recalculated the forecast. The chart below shows the newly calculated forecast for the E-mini at 10:25 AM ET. Now there is a bottom forecast just 10 minutes into the future at 10:35 AM ET at the price 2068.17. If the E-mini makes a bottom CIT at 10:35 AM ET, then I will know this revised forecast is correctly forecasting the cycle, and is working in this market today, June 9.

Click To Enlarge
The picture below was taken in the evening, around 10 PM ET and shows the price action for the 5 minute S&P500 E-mini June 9, 2015. I have manually labeled the times “2:15 PM ET” and “2:40 PM ET” and “3:20 PM ET”. I wrote above that if the forecast bottom CIT at 10:35 AM was made, I would know the forecast was working. A bottom CIT formed in the E-mini at 10:30 AM, and from that time forward the forecast for the rest of the day was fairly accurate. You can see that the basic pattern in the forecast was the same basic pattern made for the rest of the day on June 9, 2015.
I have found when using this forecasting method, when there is a CIT soon after the start of the main trading session, the forecast is most accurate if the forecast is recalculated after that CIT has formed. This allows the first CIT in the main trading session to be taken into account when the new forecast is made for the rest of the trading day. I will try to show more examples of how recalculating the 5 minute forecast after the first CIT in the main trading session occurs can improve the accuracy of the forecast.
If you like the forecast below, download the MarketWarrior 5 free trial and subscribe to the DTN IQFeed free trial and watch the forecasts on your own computer.

Click To Enlarge
End


