Article #7 Forecasting the S&P500 emini 5min chart

The chart below is a 5 minute chart for the S&P500 E-mini covering the day June 10, 2015. To create this chart I am using the MarketWarrior 5 software and the DTN IQFeed symbol @ES#. The forecast seen on this chart is the automatic E-mini forecast made by MarketWarrior 5. I calculated this forecast at 9:20 AM ET. The automatic 5 minute chart forecast covers one day. You can recalculate any time during the day if you choose, but the forecast must be recalculate at least once a day to create the forecast for the current day.

es_5minjune10_fourth

Click To Enlarge


The picture below shows the 5 minute data through the end of the day on June 10. For the three CIT that occurred during the main trading session I have added red dotted lines showing how they lined up with the price data. The first two CIT show a decline for 35 minutes between the forecast top at 9:50 AM ET and the forecast bottom at 10:25 AM ET. This decline did not take place. The second and third CIT show a rally between the forecast bottom at 10:25 AM ET and a forecast top at 12:30 PM ET. This was a correct forecast and the E-mini did rally during this two-hour time period. So during the main trading session this forecast was wrong for approximately half-hour and was accurate for approximately two hours.

If you like the forecast below download the MarketWarrior 5 free trial and subscribe to the DTN IQFeed free trial and watch the forecasts on your own computer.

es_5minjune10_fifth

Click To Enlarge

end.

Article #6 Forecasting the S&P500 emini 5min chart

Forecasting the 5 minute chart for the S&P500 E-mini is more complex than forecasting the 60 minute chart. The main reason for the added complexity is that the 5 minute chart forecast requires many more Change In Trend (CIT) to be forecast all at the same time. The charts in this discussion are 5 minute charts using the DTN IQFeed symbol @ES#, which is the continuous nearby symbol for the S&P500 E-mini. They will be showing the forecast and price action for June 9, 2015. The forecast on these charts is made using the MarketWarrior 5 automatic forecast. There are no user settings for the forecasting indicator. There is just one button to click to recalculate the forecast.

On the chart below I recalculated the E-mini 5 minute forecast on June 9, 2015 at 9:25 AM ET before the main trading session opened at 9:30 AM ET. The resulting forecast for June 9 is seen below.

es_5minjune9_first

Click To Enlarge


By the time the S&P500 E-mini had progressed about one hour into the main trading session, it was apparent that the market was not following the forecast seen above. The E-mini had made a top at 9:30 AM ET. This was not in the forecast. So at 10:20 AM ET, I recalculated the forecast. The chart below shows the newly calculated forecast for the E-mini at 10:25 AM ET. Now there is a bottom forecast just 10 minutes into the future at 10:35 AM ET at the price 2068.17. If the E-mini makes a bottom CIT at 10:35 AM ET, then I will know this revised forecast is correctly forecasting the cycle, and is working in this market today, June 9.

es_5minjune9_second

Click To Enlarge


The picture below was taken in the evening, around 10 PM ET and shows the price action for the 5 minute S&P500 E-mini June 9, 2015. I have manually labeled the times “2:15 PM ET” and “2:40 PM ET” and “3:20 PM ET”.  I wrote above that if the forecast bottom CIT at 10:35 AM was made, I would know the forecast was working. A bottom CIT formed in the E-mini at 10:30 AM, and from that time forward the forecast for the rest of the day was fairly accurate. You can see that the basic pattern in the forecast was the same basic pattern made for the rest of the day on June 9, 2015.

I have found when using this forecasting method, when there is a CIT soon after the start of the main trading session, the forecast is most accurate if the forecast is recalculated after that CIT has formed. This allows the first CIT in the main trading session to be taken into account when the new forecast is made for the rest of the trading day. I will try to show more examples of how recalculating the 5 minute forecast after the first CIT in the main trading session occurs can improve the accuracy of the forecast.

If you like the forecast below, download the MarketWarrior 5 free trial and subscribe to the DTN IQFeed free trial and watch the forecasts on your own computer.

es_5minjune9_third

Click To Enlarge

End

Article #5 Forecasting the S&P500 emini 60min chart

In this article I am going to be discussing how to use the MarketWarrior 5 automatic forecasts for the S&P500 E-mini. The MarketWarrior 5 software has an automatic forecasting tool that can forecast the 5 minute or 60 minute chart for the S&P500 E-mini. I am using the DTN IQFeed symbol @ES#. The charts below will be discussing the forecast for June 9, 2015. This article is a continuation of previous post labeled Article #4.

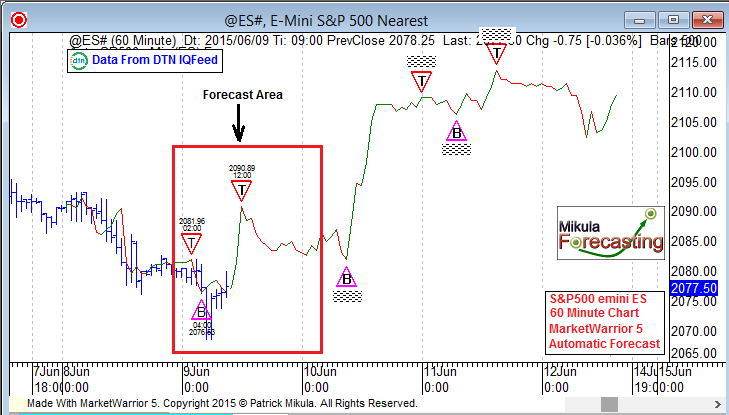
When using the automatic forecast for the 60 minute chart I will review the forecast once a day. If the forecast is working I will leave the forecast as it is. If the forecast has not been as accurate as I would like, I will click the recalculate button and recalculate the forecast. There are no settings for this forecast. There is just one button to recalculate the forecast. Based on what I saw in the over night session between June 8 and June 9 I decided to recalculate the forecast. The first chart below shows the recalculated forecast. The recalculation was done at 9:05 AM ET.  I usually do the recalculations for the 60 minute chart forecast before the main trading session opens at 9:30 AM ET.

On the chart below I have drawn a red box labeled “Forecast Area”. This box is around June 9, 2015 and this is the focus of the forecast. For June 9, 2015 there is just one CIT forecast which is for 12:00 Noon ET at the price 2090.89. The next chart shows what happened.

es_60minjune9_third

Click To Enlarge


The picture below was taken at 10:21 PM ET and shows the price action for June 9, 2015. The forecast high CIT was for 12:00 Noon ET and the high for the day came in the 1:00 PM hour just one bar away from the forecast top. There was only one CIT forecast for June 9 and the forecast was accurate. The next step is to review the forecast after the over night trading session and repeat this process for June 10.

If you like the forecast below download the MarketWarrior 5 free trial and subscribe to the DTN IQFeed free trial and watch the forecasts on your own computer.

es_60minjune9

Click To Enlarge


end.

Article #4 Forecasting the S&P500 emini 60min chart

This discussion is a forecast review for Monday June 8, 2015. The MarketWarrior 5 program can make a one week forecast on the 60 minute chart for the S&P500 emini. I am using the DTN IQFeed symbol @ES# which is the continuous nearby symbol for the emini.

The MarketWarrior forecast on the 60 minute chart is a 1 week forecast from Monday to Friday. This means the forecast must be recalculated on Monday because an old forecast will have ended on the previous Friday. I usually recalculate the forecasts at 7:00 AM or 8:00 AM before the main trading session opens. This Monday on June 8, 2015, I calculated the forecast during the 8:00 AM hour. The forecast, as it appeared when it was calculated, is shown below. I have drawn a red box around Monday June 8, because this is the focus of the forecast at this time. The other days, Tuesday to Friday may end up being recalculated so I have pixelated out their forecast times.

The current version of the automatic forecast does not label small Change-In-Trend (CIT) times and that is all there were in the forecast for June 8. This labeling issue has been corrected in the next program release. So I have manually labeled the forecast top at 10:00 AM and a forecast bottom at 3:00 PM and a forecast bottom at 1:00 AM the next day June 9. These are the three relevant CITs with which we are concerned because I may recalculate the forecast before the S&P500’s main trading session opens tomorrow. This forecast shows there should be a decline in the S&P500 emini between 10:00 AM ET and 3:00 PM ET. This forecast also indicates the price change should not be a big move. The next chart shows what happened.

es_60minjune8

Click To Enlarge


The picture below was taken during the 10:00 PM hour June 8, 2015. This picture shows the same forecast as seen above. The picture below shows there was a decline in the S&P500 emini between 8:00 AM ET and 4:00 PM ET. This shows the S&P500 on June 8 followed the forecast pattern fairly closely. When using this automatic forecast, you can not expect the market to hit the exact time and price in the forecast but the tops and bottoms should at least be close to the times in the forecast.

The proper way to use this forecast is to review the accuracy of the forecast at least once a day. If the S&P500 emini is following the forecast, you should not recalculate. If you see the S&P500 emini is not following the forecast, then you should recalculate. In this situation the forecast looks very good at the current time, but I will review the forecast on June 9 before the main trading session opens at 9:30 AM ET and I will make a decision to keep the same forecast or recalculate. MarketWarrior 5 makes an automatic forecast for the S&P500 emini (ES) on the 60 minute chart and the 5 minute chart. I will try to post reviews for a mix of the 5 and 60 minute forecasts.

es_60minjune8_second

Click To Enlarge

End

Article #3 Forecasting the S&P500 emini 60min chart

This is the follow-up discussion for “Article #2 Forecasting the S&P500 emini 60min chart”, if you did not read that article you should read that first to help understand this discussion.

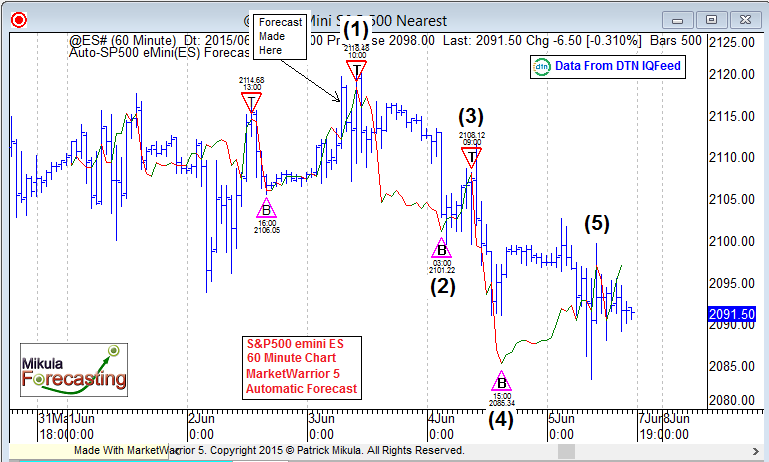
MarketWarrior 5 makes an automatic forecast for the S&P500 emini 60 minute chart. On all of these charts, I am using the DTN IQFeed symbol @ES#. The 60 minute forecast covers the current week from Monday to Friday. When using the 60 minute forecast, I review the forecast once a day. I review it usually in the morning before the main trading session opens, and if the forecast is accurately identifying the Change In Trend (CIT) points, I leave the forecast as it is. If the forecast has diverged from the market action, then I recalculate the forecast. The forecast does not automatically recalculate. Normally I will recalculate the forecast no more than once a day before the main trading session opens.

The chart below shows the automatic forecast, which was calculated at 7:00 AM on Wednesday June 3, 2015. This chart runs through 8:00 AM Thursday June 4, 2015.  When I reviewed the forecast in the morning of June 4 before the main trading session opened, the forecast had accurately identified the CITs labeled (1) and (2). The CIT (1) occurred in the previous day and CIT (2) occurred in the early morning hours. Because this forecast was continuing to accurately identify market turning points, I did not recalculate the forecast.

es_60minjune3_9am

Click To Enlarge


The next chart shows how the forecast worked out for Thursday June 4, 2015. The automatic forecast had three CIT on Thursday, June 4. I have labeled these (2), (3) and (4). These CIT points were all accurate. The chart below runs through Friday June 5, 2015 at 6:00 AM. When I reviewed this chart on Friday morning before the main trading session opened, I saw the forecast was continuing to identify CIT points so I did not recalculate the forecast. There was now only Friday left in this forecast.

es_60minjune5_6am

Click To Enlarge


You can see below how the forecast worked out for Friday June 5, 2015. The end of the forecast on Fridays sometimes does not get labeled because there is no significant CIT as was the case on the Friday seen below. We will be correcting that in a future release so the Friday end point is always labeled with the forecast time and price.

es_60minjune5_end

Click To Enlarge

End

Article #2 Forecasting the S&P500 emini 60min chart

In this article I am going to discuss forecasting the 60 minute chart for the S&P500 emini. On the charts below, I am using the DTN IQFeed symbol @ES#, which is the continuous nearby contract for the S&P500 emini.

The chart below shows the 60 minute data for the S&P500 emini. The last bar on the chart is for the time 7:00AM ET and the date is June 3, 2015. At this time I clicked the button in the MarketWarrior 5 program to update the forecast. The resulting forecast is shown below. I recommend recalculating the 60 minute forecast only once a day. In most cases I will recalculate the 60 minute chart forecast before the main trading session opens at 9:30AM ET. In this case I recalculated during the 7:00AM hour at approximately 7:45AM.

On the chart below, the red arrows with a T inside identify the forecasts for top change-in-trend. The triangles with a B inside identify, forecast bottom change-in-trend. Because I recalculate the 60 minute chart forecast once a day I usually only use the forecast change-in-trend forecast for the upcoming day. On the chart below, there is one forecast change-in-trend during June 3, 2015. This is a forecast for a top at 10:00AM ET at the price 2118.48. To clearly shows this, I have placed the cursor on this time so you can see the cursor pop-up box. This is circled in red on the chart below. I have also added (1) next to the forecast. Now we will see how this forecast worked out.

es_60minjune3_643am

Click To Enlarge


The picture below shows the same forecast for the 60 minute chart of the S&P500 emini. You can see that on the chart below on June 3, the forecast was for a top in the 10AM ET hour near the price 2118.48. The chart below shows the S&P500 emini made the high for the day in the 10AM hour. This was the only forecast change-in-trend for June 3 and the forecast worked out very well.

es_60minjune3_update5

Click To Enlarge

End

Article #1 Forecasting the S&P500 emini 5min chart

Here is the first in a series of articles discussing how to use the automatic Master Time Factor (MTF) forecasts in MarketWarrior. The automatic MTF forecast for the S&P500 emini works on both the 5 minute and 60 minute time frames. The chart below shows a 5 minute chart for the S&P500 emini. The exact symbol used is the DTN IQFeed symbol @ES# which is the continuous nearby contract. The chart below runs through June 3, 2015 7:25AM Eastern Time (ET). At 7:25AM I clicked the button in MarketWarrior to recalculate the forecast for this chart. The green line on the chart below is the forecast line. The red triangles with a T inside, identify the forecast tops. The triangles with a B inside, identify the bottom forecasts.

There are four forecast change in trend times on the chart below. Number (1) is a top forecast for 9:30AM ET at the price 2117.65. Number (2) is a bottom forecast for 10:50AM ET at 2110.21. Number (3) is a top forecast at 13:40(1:10PM) ET at the price 2116.30. Number (4) is a bottom forecast at 14:25(2:25PM) ET at the price 2110.21. In the second chart below, I show what happened with this ES forecast.

es_5minjune3_637am

Click To Enlarge


The MTF forecast for the S&P500 emini, 5 minute chart, turned out to have the cycle tops and bottoms inverted but the timing was very good. It is common to have the timing of a forecast correct but the top/bottom inverted. Let’s take a look at each forecast point.

The number (1) forecast saw the day’s largest price range for a 5 minute price bar. The price fell and made a bottom. The number (1) change in trend forecast was for a top at 9:30AM ET and a bottom was made at 9:35AM. The number (2) forecast was for a bottom at 10:50AM ET. The S&P500 emini made a top very close to this forecast time. The number (3) forecast was for a top at 1:40PM ET and this was the time when the S&P500 emini started a fast rally. The number (4) forecast was for a bottom at 2:25PM ET and at this time a top was made in the emini. The chart below covers the 3PM and 4PM hours, which are not shown above. This time period includes forecast number (5) which was for a top at 15:25 (3:25PM) ET at the price 2115.96. At this forecast time, the S&P500 emini made a bottom and started a rally. For all five forecasts, the top/bottom forecast was inverted but the timing of the change-in-trend was very good.

Take a look at the charts above and below. Ask yourself if having a forecast like this for the S&P500 emini 5 minute chart would help improve your trading. If your answer is yes, then download the MarketWarrior 5 free trial and sign up for the DTN IQFeed free trial which is a one week free trial.

es_5minjune3_637am_update

Click To Enlarge

End.